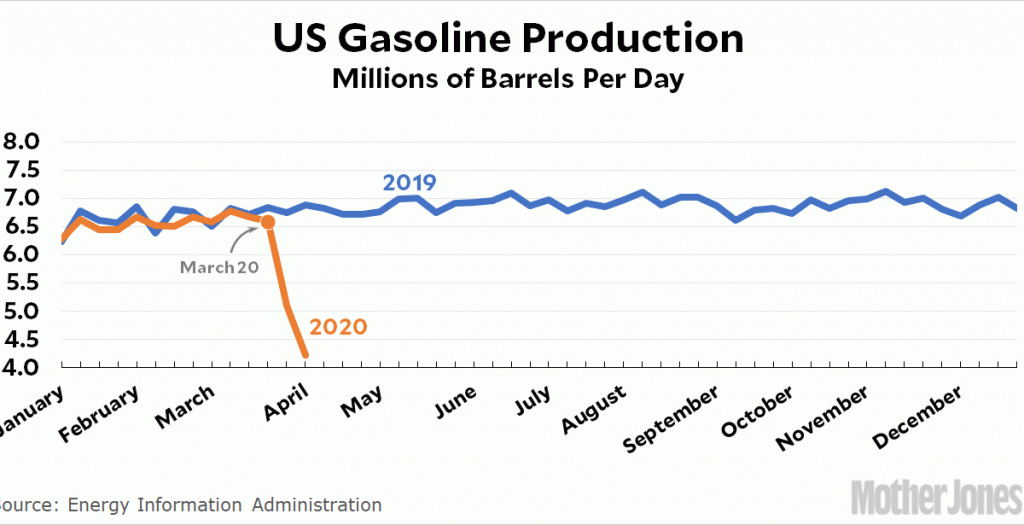
Raw Data: Gasoline Production During the Pandemic
I don’t have any special reason for posting this. It’s just interesting raw data.
And here’s a related one. It’s from Apple and shows how many people used their iPhones to request driving directions:
This chart is pretty noisy, but it still gives you an interesting look at when people started taking COVID-19 seriously, regardless of when national governments imposed formal lockdowns. If you take requests for directions as a rough proxy for overall driving, Italy started driving less on February 29. The rest of Europe and Canada followed on March 5-7. The United States was a laggard, not starting to decline until March 13.
You can also get a feel for which countries took their lockdowns the most seriously. Sweden, with its famously casual approach, has reduced its driving by a modest 34 percent. Spain reduced its driving by a whopping 91 percent. Here’s a complete list:
If you want to play with this data some more, just click the link. The Apple spreadsheet also includes driving requests for individual cities if you want to compare, say, New York and Los Angeles directly.