Lying With Statistics: Republican Tax Cut Edition
I was doing a bit of research today for an article I have in the works and I happened to run across a great example of lying with statistics. That doesn’t happen to be part of the remit of the article, but I hated to let it go to waste. So here it is.
A couple of weeks ago the White House released a brief statement describing how great their 2017 tax cut has been for the economy. One of the predictions they made back at the time was that the tax cut would spur higher levels of business investment, which would then have knock-on effects on growth, productivity, and wages. According to the White House, this has been hugely successful:
Investment levels have been notably higher in the post-TCJA period than Blue Chip’s pre-TCJA projections from October 2016. In 2018, investment was 4.5 percent higher than the projections. In 2019, investment was 3.3 percent higher than the projections and the capital stock is on track to expand across each major asset class (equipment, structures, and intellectual property products).
And here’s the chart to prove it:
Huh. The starting point for the comparison between projected and actual is 2016. But who cares about growth between 2016 and 2017? That’s before the tax cut passed. What we should do is begin the comparison with the end of 2017. I have used my mad charting skills to do just that:
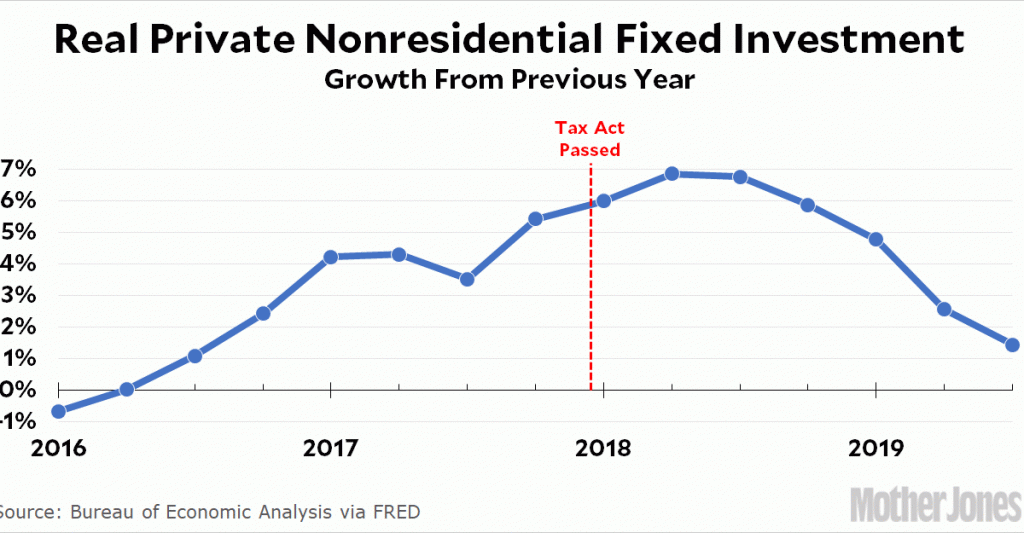
I moved up the blue dashed line so that it crosses the red line at 2017 and this cuts the effect in half right off the bat. But even this is merely a comparison of actual growth with an old consensus projection that may or may not mean anything. What’s more, it’s charted annually. There’s no need for either of those since we can calculate growth rates directly and BEA provides us with quarterly figures. Let’s look at that:
That . . . doesn’t look so great. The growth rate of business investment had been steadily rising for two years, but within six months of the tax cut it started to decline. In the most recent quarter it was barely more than 1 percent above the previous year.
The folks in the White House worked hard to dream up a chart that would make the tax cut look good, and they get three cheers for effort. Some bright young spark burning the midnight oil probably came up with the idea of using a comparison with an old forecast, and the old pros must have beamed with pride when they saw it. But even on its own terms their chart is a fake, and if you instead take a simple look at the growth rate of business investment then it’s obvious that the tax cut had no effect at all—except possibly for a negative one. Even the decline is a little hard to conclusively blame on the tax cut, however, since Trump’s trade war probably had something to do with it too.
Either way, however, business investment obviously didn’t skyrocket following the tax cut.