Here’s How Different Groups Really Voted in 2018
Looking for news you can trust?Subscribe to our free newsletters.
Did Hispanics turn out in greater numbers this year than they did in 2014? I didn’t even bother looking at the exit polls for this, since virtually no one seems to trust them anymore. However, before the election Yair Ghitza at Catalist promised a super-sophisticated analysis that would give us the real straight dope. I looked for it the day after the election, but I guess it took a few days to get the numbers together. Here they are:
If Ghitza’s numbers are correct, all of Donald Trump’s very public hostility to Hispanic issues had pretty much no effect on Hispanic voting. In raw numbers, turnout was up among all groups, but Hispanic turnout wasn’t up any more than anyone else. They’ve been at 6-7 percent of the electorate since 2008, and actually dropped from an all-time high of 9 percent in 2016. What’s more, Andrew Gelman points out that their support for Republicans was actually a bit higher than it was in 2016 (though lower than in 2014).
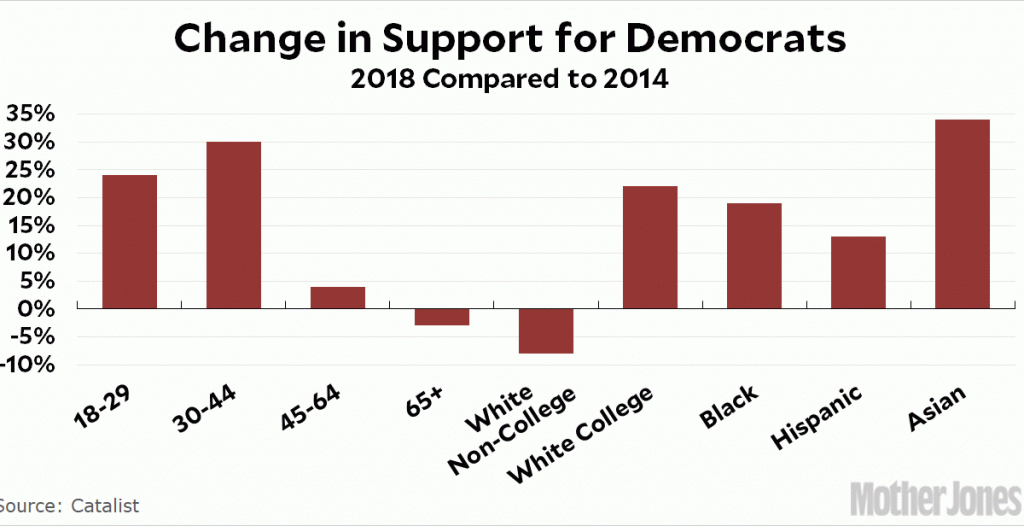
Ghitza’s post about the demographics of 2018 is here, and it contains lots of interesting stuff. Here are Catalist’s estimates for the change in support for Democrats among various demographic groups:
Interestingly, the biggest Democratic pickup among age groups wasn’t the youngest voters, but the 30-44 group. Less surprisingly, the Catalist data confirms that the rift between college and non-college whites has turned into a chasm: compared to 2014, support for Democrats went up 22 points among college whites while it went down 8 points among non-college whites. That’s a net 30-point change in just two years.
My guess is that the Catalist data is the best we have at the moment. As usual, truly good data will have to wait a year or two.