Here’s a Middle Class Index™ for Chuck Schumer
Looking for news you can trust?Subscribe to our free newsletters.
Sens. Chuck Schumer and Martin Heinrich think that GDP is a pretty imperfect measure of economic growth. So they want some new statistics:
The idea, they say, is to shed light on where economic prosperity is showing up across different income groups — and, potentially, where it’s not. The bill, the Measuring Real Income Growth Act of 2018, would require the Bureau of Economic Analysis (BEA), which releases quarterly GDP numbers, to also report how growth is distributed along the income scale. The bureau would have to put together distributional measures of economic growth to be released with quarterly and annual GDP reports starting in 2020, laying out how growth shows up across each decile of earners and the top 1 percent.
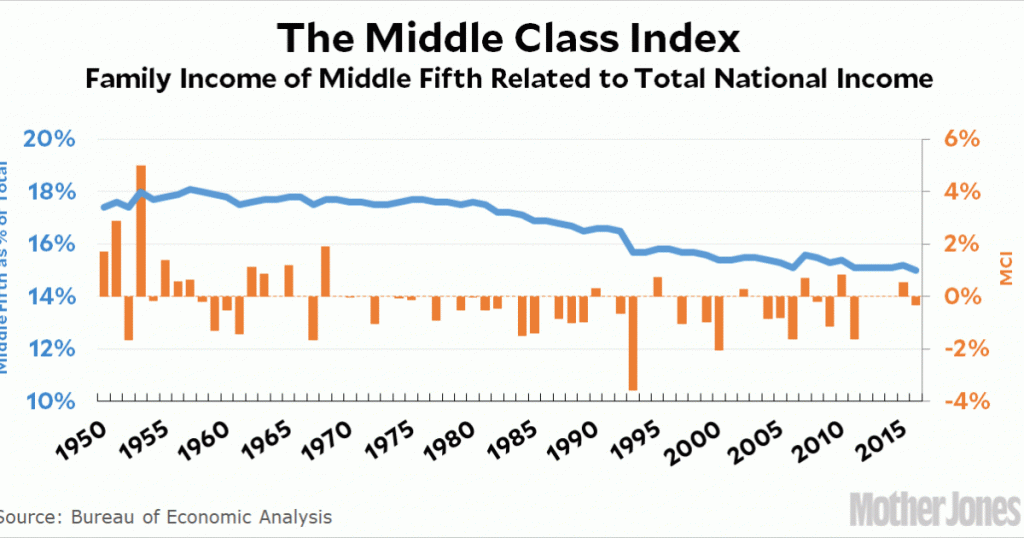
That’s all fine, but in the meantime here’s something you can already use for much the same purpose:
The blue line shows the total income of the middle fifth as a percentage of total national income. In the 1950s, the middle fifth received about 18 percent of total income. By 2016 that was down to 15 percent. However, this is just a measure of income inequality, and we all know that income inequality is going up. What’s more, it can be deceptive: the middle-fifth share could be going up while national income is going down. That’s hardly the sign of a strong economy.
That’s where the orange bars come in. This is my patented Middle Class Index, and I’ll be the first to concede that it’s pretty arbitrary: it’s just the change in the share of income going to the middle fifth multiplied by the change in real national income times a special constant.¹ It only goes up if both are going up, and it goes up more if either one goes up more. I’ll leave it to real economists to come up with something better, but this at least provides a general sense of how things are going.
For example, in 1950 the MCI was 1.72. Not bad! That’s because national income went up a lot and the share of the middle fifth went up. Conversely, in 2016 the MCI was -0.33. National income went up a little bit, but the middle fifth share declined, so the overall result is negative.
So what should the MCI be? Your guess is as good as mine. Offhand, I’d like to see the share of the middle fifth go up maybe a tenth of a point on a regular basis,² and national income go up by around 3 percent. That produces an MCI of 0.1. Anything above that is usually good news. Anything below it probably isn’t.³
So how was 2017? National income went up 2.4 points, which is OK, but we don’t know yet how the middle class did. As soon as BEA gets around to crunching the numbers for 2017, I’ll report back.
¹OK, fine, the special constant is one-third. There’s no special reason, it just made the index number seem sort of reasonable. Feel free to use your own. The bigger the constant, the more weight you’re giving to an increase in national income.
²Obviously it can’t go up forever, but I’ll worry about that around 2050 or so. If the share of middle-fifth income is back up to 18 percent, we can start thinking about some other measure.
³Probably. It’s possible, of course, for national income to go up a lot while middle-fifth share goes down enough to produce an actual decrease in middle-fifth income. But that would be rare.


