Three Charts Show How Important COVID-19 Countermeasures Are
Why has California done better than New York in suppressing the spread of COVID-19? There are several reasons, but one of them is that California adopted lockdown measures sooner than New York. California beat New York by three days, and when you count in local lockdowns ordered by cities and counties it’s more like seven days. Here’s a stylized¹ look at what that can do:
The blue line represents California, which adopted physical distancing measures at the beginning of the month and reduced the daily growth of coronavirus from 20 percent to 15 percent. The orange line represents New York, which did nothing for the first week but then adopted physical distancing measures for the rest of the month. There are two things to notice here:
The obvious one is that California ends the month with 30 percent fewer COVID-19 cases.
The other one is that up through Day 12 you don’t really see any difference at all. As it happens, that’s also a 30 percent difference, but the absolute numbers are so small it looks like statistical noise. It’s only when you get to about Day 20 that you really start to see the difference.
Now here’s a more extreme example: California adopts strict physical distancing measures while State A blows it off entirely. Here’s what it look like:
You can notice the same two things, except exaggerated:
By the end of the month, State A ends up with a whopping 70 percent more COVID-19 cases than California.
The difference is barely noticeable on Day 12. As above, the difference is actually substantial, but the absolute numbers are so small they’re barely noticeable.
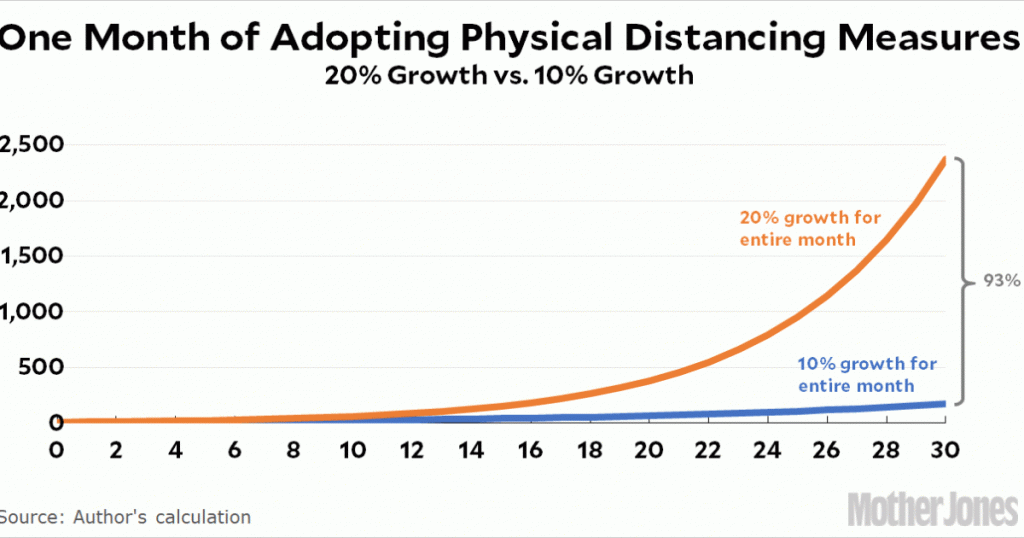
These are just rough guesstimates applied solely to physical distancing. If you add in business closures, school closures, stay-at-home orders, and so forth, the difference in the growth rate will likely be far greater than 5 percentage points. If you want to see something truly impressive, check out a comparison of two states where one of them cut their growth rate in half with even more stringent countermeasures:
By the end of 30 days, the blue state has reduced its COVID-19 growth rate by 93 percent compared to the orange state that did nothing. This probably represents approximately what happened between California and New York. But note once again that you barely even notice any difference until around Day 10 or 12. That’s how long it takes for these annoying countermeasures to really have an effect.
It’s just like compound interest: a small change in the rate makes a big difference, and the longer you hold your money the bigger the difference becomes. So obey your lockdown orders! A couple of years from now we’ll undoubtedly have dozens of research papers that tease apart all the various countermeasures and figure out which ones worked and which ones didn’t. And of course this will all be cleverly controlled for demographics; reporting accuracy; cigarette smoking; general health at the national level; and better ways of estimating deaths consistently across countries. This will be enormously helpful when we run into our next pandemic. For now, though, all we know in a very general way is that countermeasures seem to work and can have a huge impact if they’re put in place early and kept in place for long periods.
In other words, forget the peak we’re supposedly coming up to next week. We don’t just want to suppress COVID-19, we want to crush it, and to do that we need to keep countermeasures in place at least through the end of May and possibly through the end of June. After all, a greater rate of decline on the downside of the curve is just as important as a lower rate of growth on the upward side of the curve. Our motto going forward needs to be: A bit of pain now will save us all a great deal of pain in fall.
¹Stylized means this isn’t a real example with real numbers. I plugged in the growth numbers myself just to illustrate a point.


