Taxes, Welfare, and Income Inequality: Here’s the CBO’s Latest Report
Looking for news you can trust?Subscribe to our free newsletters.
The CBO has released its annual report on the distribution of household income, and they’ve changed things up this year. They’re now measuring income in two ways:
Before taxes and transfers. This is basically market income.
After taxes and transfers. This is market income plus means-tested welfare benefits minus taxes paid.
This is handy because it allows us to zero in on the way that social welfare benefits change income distribution. There’s nothing surprising in this year’s report (which goes up through 2014), but it’s a good excuse to review some of the basics. Here are a few charts from the report.
The personal income tax is basically the only progressive federal tax we have. Everything else put together is a flat tax:
Two-thirds of welfare benefits come from Medicaid. Everything else—food stamps, WIC, Section 8 housing, etc.—amounts to only about a third of all benefits for the poor.
Welfare benefits make a difference. As the chart above shows, means-tested welfare benefits increase the income of the poorest by over 60 percent. Since 1980, market income for the poor has grown about a third as fast as market income for the well-to-do, but when you account for welfare benefits it’s grown nearly half as fast—and it’s grown faster than middle-class incomes.
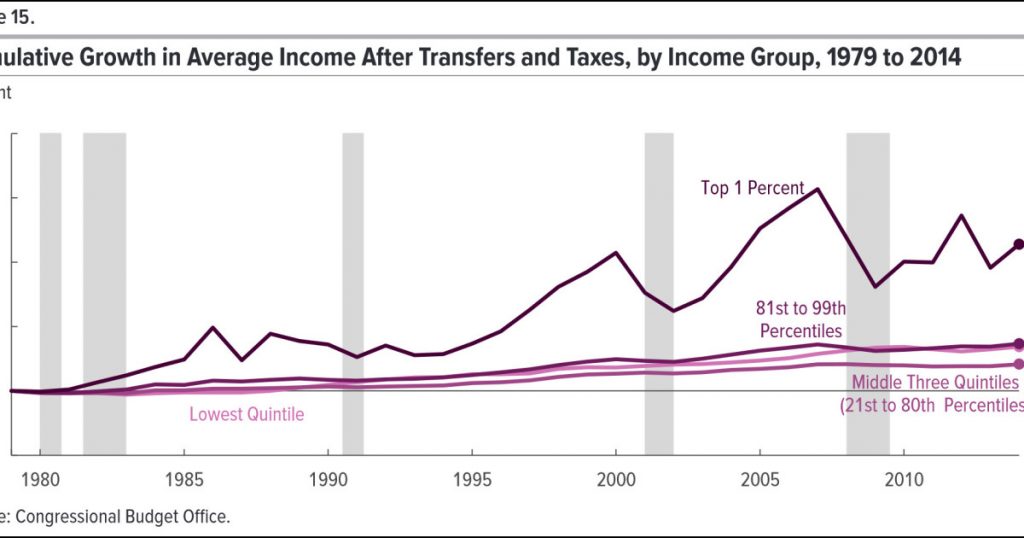
The rich continue to outpace everyone. Even after you account for welfare benefits, the incomes of the top fifth have grown faster than anyone else. And the incomes of the top 1 percent have grown way faster.
It’s worth remembering that CBO figures are pretty solid. They count cash income, benefits (mainly health insurance), Social Security, welfare benefits, and taxes. It’s a very broad overview of total income.