Our Grocery Store Riddle Is (Partially) Solved
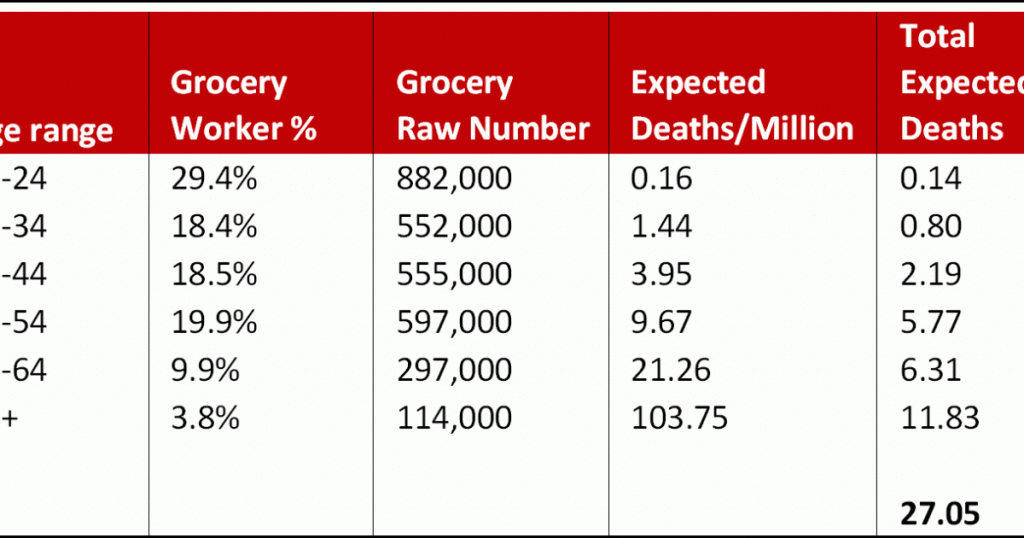
Aha! Reader JK emails to propose a solution to the mystery of the healthy grocery workers. It didn’t occur to me that there was a source that broke down grocery workers by age, but in the era of the internet there’s a source for everything. The numbers here are from 2008, but I don’t imagine they’ve changed a lot since then. You can combine them with the CDC’s numbers for coronavirus deaths by age group here. What you get is this:
Take a look at the top line. Those aged 16-24 make up 29.4 percent of all grocery workers. Out of 3 million total workers, that comes to 882,000 people. The CDC says the death rate in that age cohort is 0.16 per million, which means we’d expect about 0.14 deaths among all grocery workers of that age. Now do that for all age groups and add them up. You get a total expected death toll of 27 out of 3 million.
In reality, there have been 41 deaths, about 50 percent higher than you’d expect from that age distribution.
This is still a guesstimate, and there are obviously other factors that might be at work. But by using more detailed demographic data, it looks like grocery workers really do skew quite young and should be dying at a pretty low rate. Their higher-than-expected rate is presumably due to being exposed to the virus far more than the general population.
Now, I still think there’s a bit of a mystery here. Grocery workers are exposed to the general population for eight or more hours per day with little protection. Social distancing is difficult; shoppers don’t all wear masks; and transmission risk should be high. And yet the death rate is only 50 percent higher than expected? I’m not being callous here: I know that 50 percent represents a lot of people. But epidemiologically speaking, wouldn’t you expect a bigger difference than that between, essentially, no countermeasures (grocery stores) and full countermeasures (rest of the world)?


