Middle-Age Death Rates Have Skyrocketed in Some States
Looking for news you can trust?Subscribe to our free newsletters.
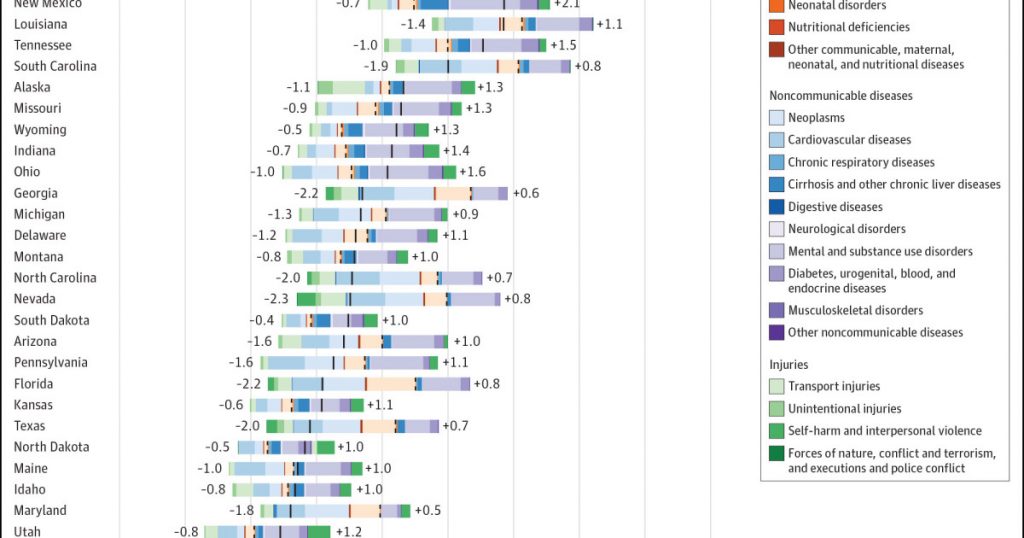
Via Eric Topol, here’s an interesting chart from a new report in JAMA. It shows how the probability of death during middle-age has changed from 1990-2016 in all 50 states. In the country as a whole, there’s been a 1.7 percentage point decrease in the probability of death from various causes and a 0.7 point increase, for a net change of -1.0 percent.
Southern states tend to have the highest probability of death and the biggest increase since 1990. In Mississippi, for example, you have an 11 percent chance of dying between ages 20-55, and that’s gone up 0.2 points since 1990. Kentucky has gone up by 1.2 points, Oklahoma by 1.6 points, and West Virginia by 2.2 points.
In California and New York, by contrast, the probability of death is about 5.5 percent, and that’s gone down by 3.2 points in New York and 2.1 points in California.
The differences here are huge and are “strongly linked to the burden of substance use disorders, cirrhosis, and self-harm.” I imagine they’re also linked to the effort each state has put into improving its health care system. There’s more at the link, including the same chart for ages 0-20 and ages 55-90.