Chart of the Day: The Gun Homicide Mystery
Looking for news you can trust?Subscribe to our free newsletters.
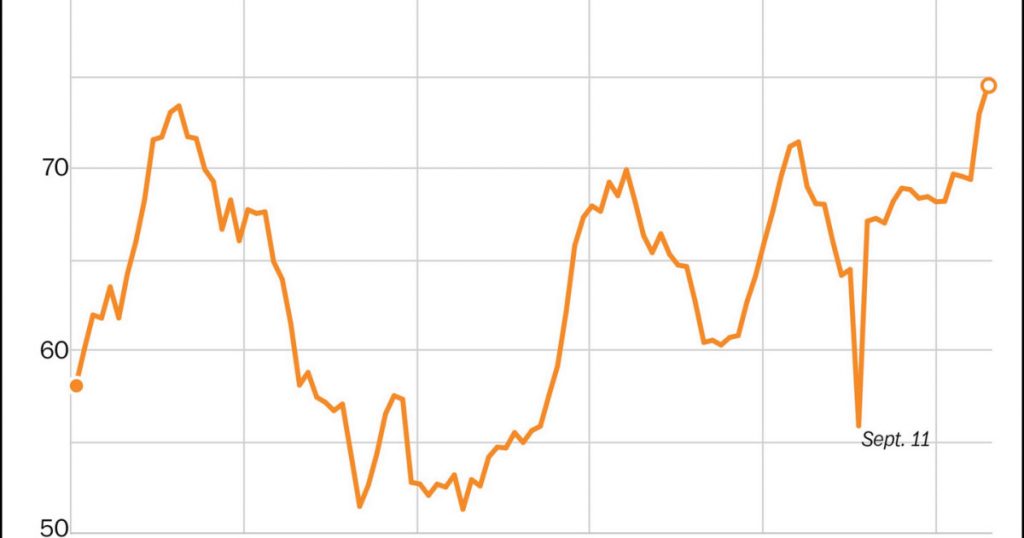
Wonkblog has an intriguing chart up today. It shows the percentage of homicides committed by guns over the past century:
Note that this is not the homicide rate. It shows only the relative popularity of using guns to kill people:
There’s a big spike in gun popularity around 1920.
There’s another big spike around 1970.
There’s another big spike around 1990.
Finally, there’s a moderate spike starting in 2015.
I find this mysterious. Why do guns bounce up and down so much as the weapon of choice for murdering people? And what took their place in, say, the 1950s? Knives? Is there any other method of killing people that accounts for a big share of homicides?
I can think of possible explanations for each wave of gun violence. Maybe it was mob killings in 1920; a tidal wave of cheap handguns in 1970; crack in 1990; and gang violence in 2015. But those are just guesses based on nothing at all. However, I can’t even think of a wild guess that might explain the general cyclical nature of gun popularity. It seems to go in a roughly 20-year cycle with the exception of 1950.
Anyone have any ideas?